FinkAvenue
Visa Stock: growth at a reasonable price
The thesis of this article is quite straightforward. I will argue that A) Visa Inc. (NYSE:V) represents a good GARP opportunity (Growth At a Reasonable Price) under current conditions, and B) the opportunity is further enhanced by its sizable share repurchases.
Trading at around 28x FWD P/E, V’s valuation is not cheap by any means. However, to be detailed in the next section, once its growth potential is factored in, the valuation appears quite reasonable. The chart below shows the consensus EPS estimates for V stock in the next 5 years. As you can see, analysts expect Visa’s EPS to grow at a compound annual growth rate (“CAGR”) of 11.3% from fiscal 2024 to fiscal 2026. This translates to an EPS growth of $9.94 for fiscal 2024 to about $17.04 in fiscal 2028. As just mentioned, at its price, Visa’s forward P/E ratio based on fiscal 2024 EPS is around 28x, but it will decline quickly as EPS grows. The forward P/E ratio is expected to reach 19x by fiscal 2027 and 16x by 2028, which are both quite reasonable levels.
Seeking Alpha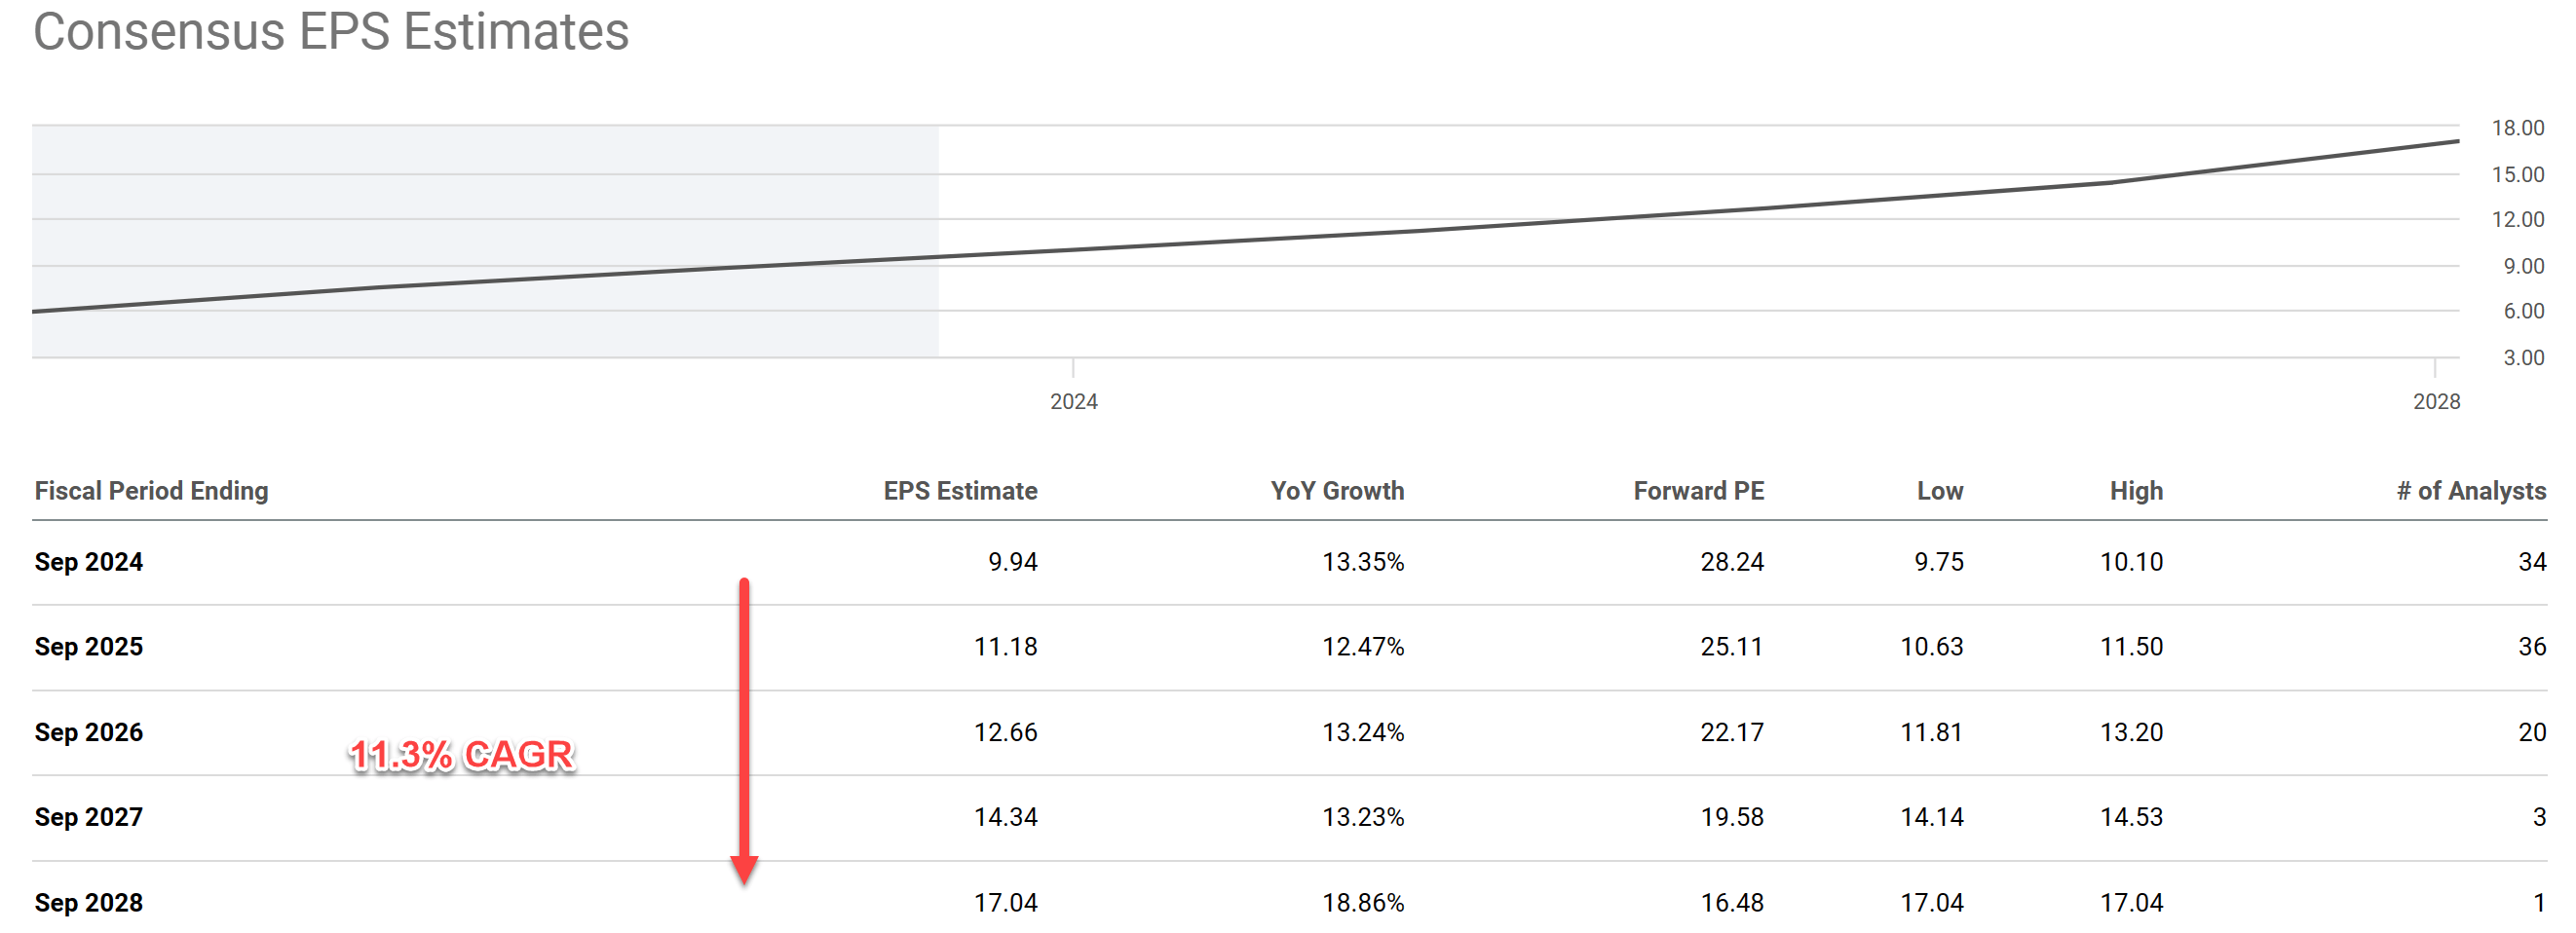
Of course, the next question is if the above growth projection can indeed be materialized. My answer is very likely thanks to the many growth catalysts afoot and V’s terrific return on capital employed (“ROCE,” more on this in the next section).
V is the leader in the electronic payments space (see the next chart below, showing the number of purchase transactions made through the major platforms). In terms of dollar volume, the amount is truly staggering. Hope the following quotes from Visa’s 2023 CEO Letter give you a good idea of the magnitude:
Today, Visa’s network spans more than 200 countries and territories, approximately 14,500 financial institutions, more than 130 million merchant locations, and 4.3 billion payment credentials. All told, during our FY23, the Visa network enabled $15 trillion in total volume and 276 billion transactions.
Thanks to its scale, brand recognition, and geographical reach, V is well-positioned to capitalize on the growth of digital transactions and e-commerce expansion. For example, during the first six months of fiscal 2024, revenues and earnings increased 9.3% and 15.2% YOY, respectively. Transaction volumes continue to rise at a good clip. During the fiscal 2024 second quarter, total dollar volumes in Europe, Asia/Pacific, and Latin America expanded 12.9%, 2.2%, and 11.9%, respectively, from the prior-year period. Business was also robust in North America, with volumes up 5.5% and 5.6%, respectively, in Canada and Visa’s home market of the United States.
Next, I will analyze its ROCE to argue why I consider such robust growth to be sustainable.
Statistica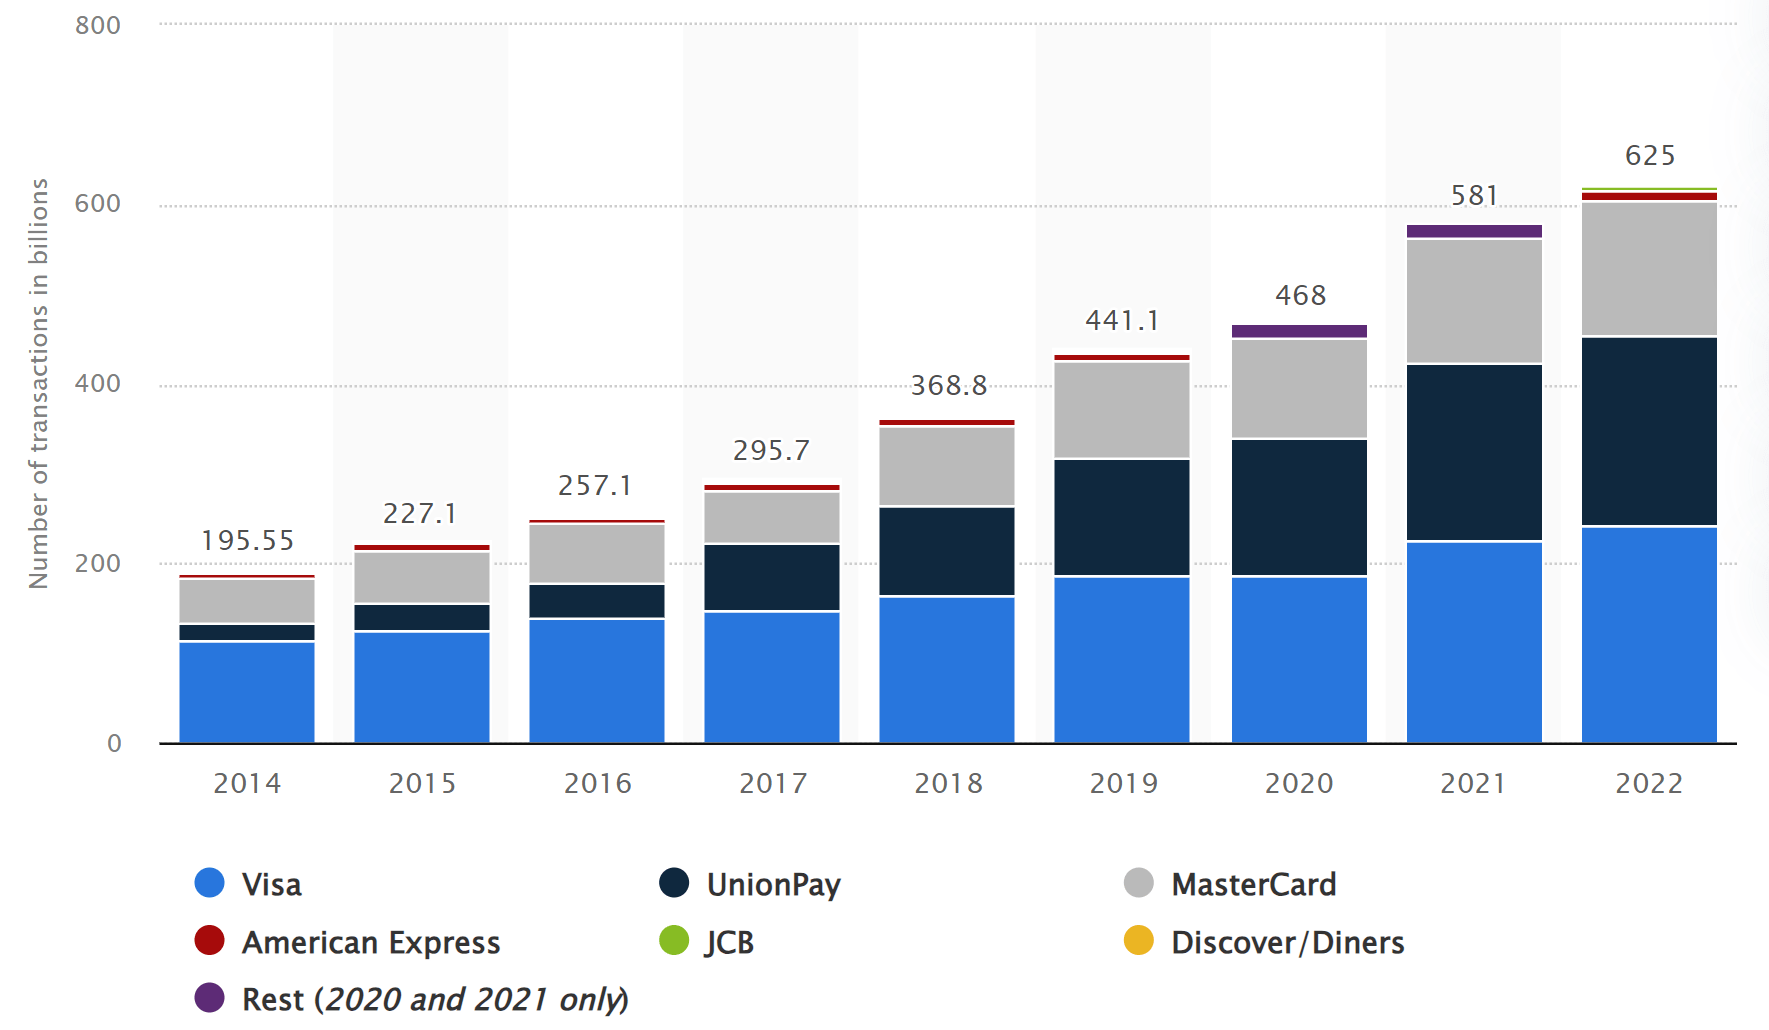
V stock: long-term growth and fair price estimation
My method for estimating the long-term growth rates involves the use of ROCE and reinvestment rates. It is detailed in my other articles. So I will only quote the result below:
The method involves the return on capital employed (“ROCE”) and the reinvestment rate (“RR”). The ROCE for V has been around an average of 105% in the long term as seen in the chart below. Its RR is about 10% on average in recent years. With these inputs, V’s organic growth rate would be ~10.5% (105% ROCE x 10% RR = 10.5%). Note this number is the real growth rate without inflation. To obtain a notional growth rate, one would need to add an inflation escalator. Assuming an average inflation of 2% would bring the nominal growth rate to 12.5%, quite close to the consensus estimates above.
Author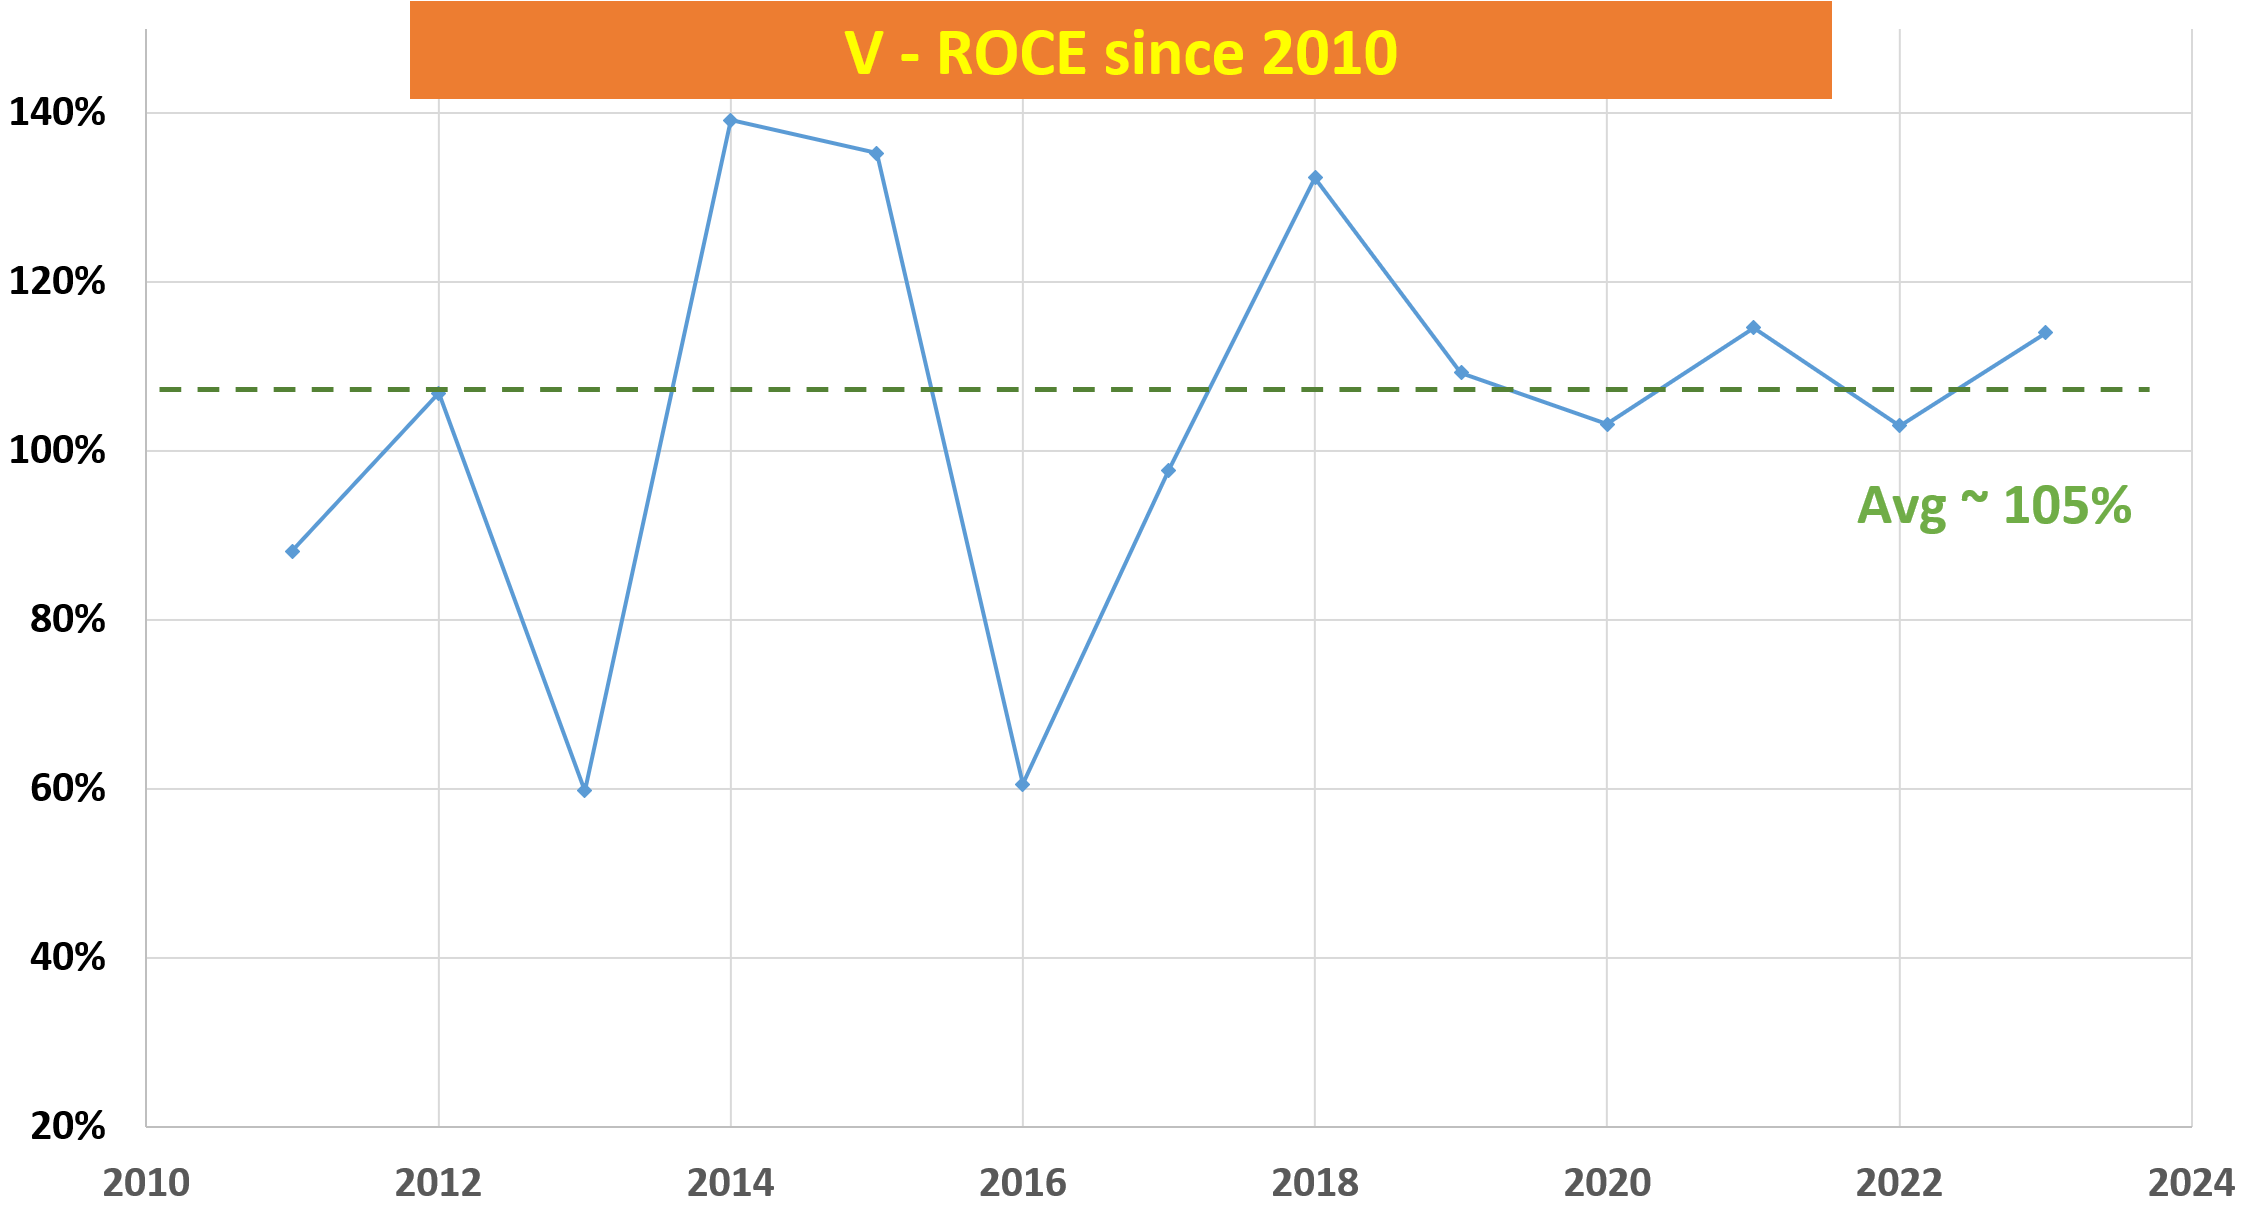
With such a growth estimate, we can also quickly estimate its fair price using a discount FCF (free cash flow model). In particular, I will use a two-stage FCF model as detailed in my earlier article:
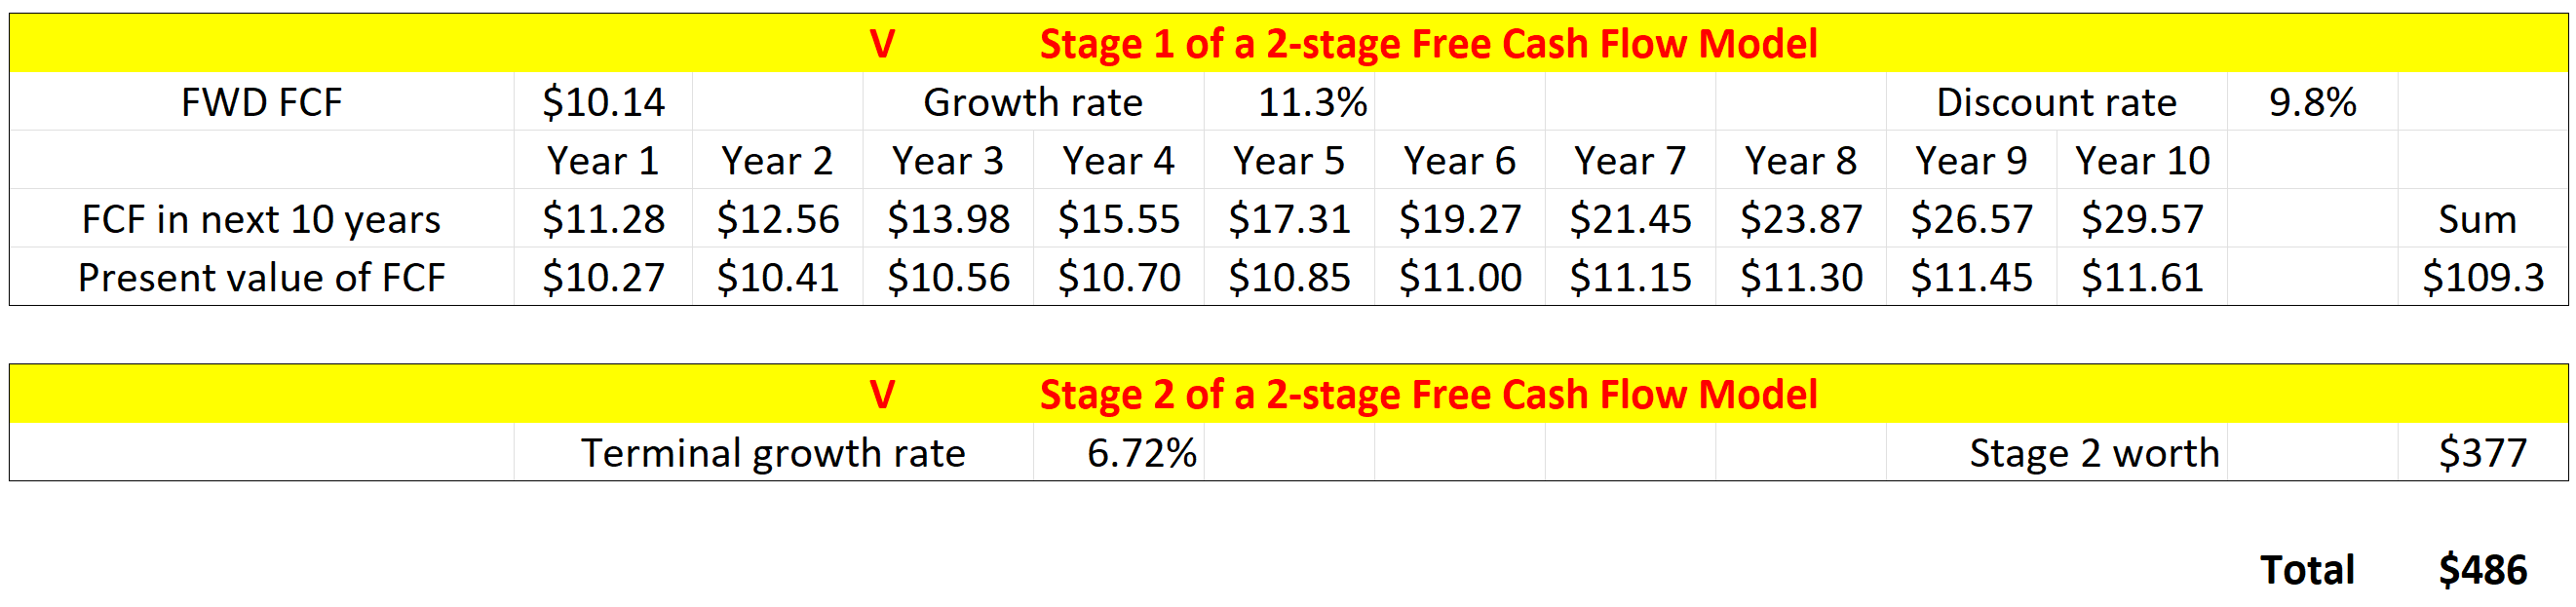
The model uses a higher growth rate in the first stage and a lower rate in the second stage to capture its terminal growth. There are a total of 3 key parameters in the 2-stage FCF: the discount rate, the growth rate in stage 1, and the terminal growth rate. For the discount rate, I relied on the so-called WACC, the weighted average cost of the capital model. The discount rate for V is about 9.8% on average in recent years following this model.
For stage 1, I will just go with the 11.3% growth rate implied by consensus estimates. For the terminal growth rate, I will assume an RR of 4.5% in the terminal stage (which is about the average of its peers). This assumption points to be terminal growth rate of 4.72% (105% ROCE x 4.5% RR = 4.72%). Again, adding an inflation of 2% would bring the notional terminal growth rate to 6.72%. Finally, for its FCF, I plugged in $10.14 per share, inferred from the FY FCF yield shown below.
With all the inputs mentioned, the last table summarizes the results from the 2-stage discounted FCF model. As seen, despite the off-putting valuation grades, V’s current price is actually at a large discount compared to its fair price.
Seeking Alpha Author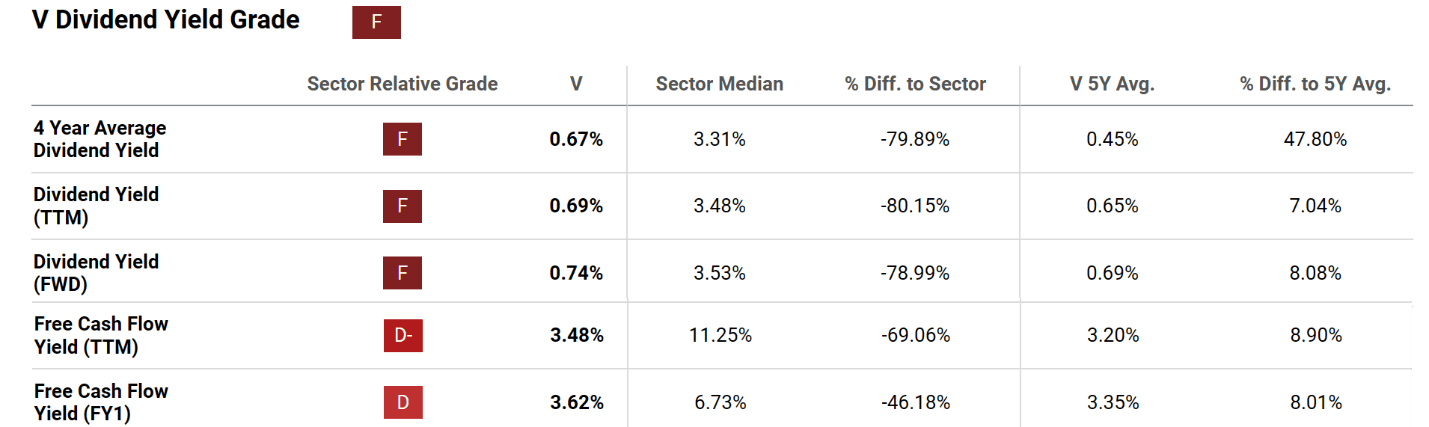
Other risks and final thoughts
To add the icing on the GARP cake, V has been consistently buying back its own shares in the past. More specifically, the chart below shows the V stock’s share buybacks since 2021 (top panel) and the corresponding net common buyback yield (bottom panel). As seen, there are some quarterly fluctuations in its buybacks, but V remained a consistent buyer (and quite a sizable buyer) of its shares. The highest level of buybacks was in late 2021 at around $4.1 billion. The most recent buyback reported was about $2.76 billion. Overall, the amount spent on shares repurchasing is on average $2.93 billion each quarter in the past 3 years.
To better contextualize things, this average amount translates into an average net common buyback yield of around 2.25% as seen in the bottom panel. Combined with the cash dividend (currently about 0.7% if you recall from an earlier chart), the total shareholder yield is about 3%, approaching the type of dividend yield that many dividends investors target. For me, I always prefer repurchases (that is when made at close to or below fair price as the case here) than cash dividends for the following tax considerations:
Stock buybacks are also way more tax-efficient for both the company and the shareholders. With a stock buyback, shareholders don’t realize any capital gains or losses until they actually sell their shares. This allows them to defer paying taxes on any appreciation in the stock price. In contrast, with cash dividends, first, they are taxed twice. First, it is taxed at the company and then shareholders owe taxes again as income once they receive the amount – regardless of whether they reinvest the dividend or spend it.
Seeking Alpha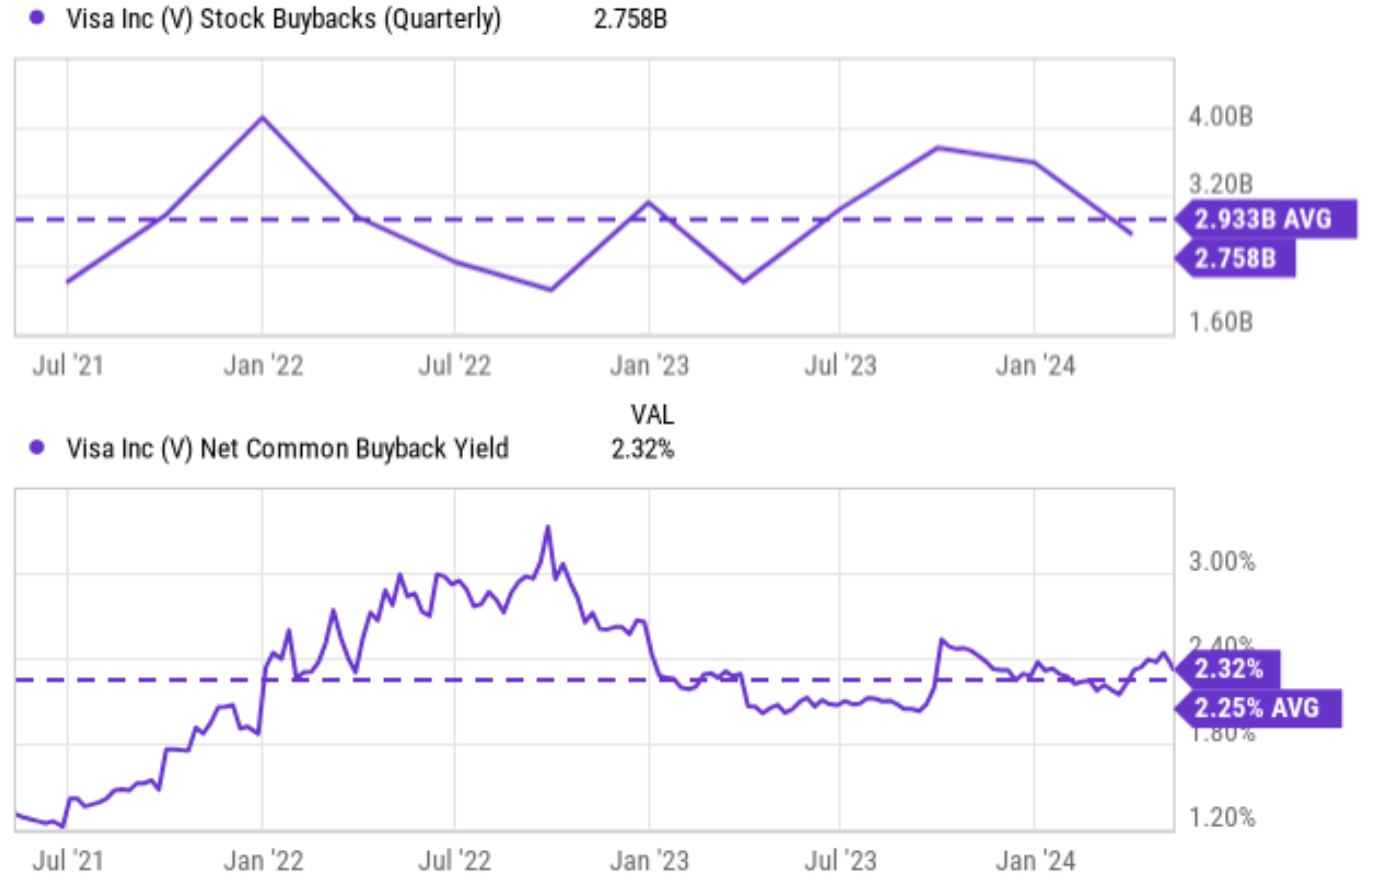
In terms of downside risks, Visa and its payment-processing peers face some common risks such as economic downturns, competition, regulation, etc. During recessions, consumer spending typically falls, reducing transaction volume and payment fees. Additionally, the payments landscape is fiercely competitive, with other established players like Mastercard (MA) and PayPal (PYPL) vying for market share alongside new entrants like fintech startups. As the leader in the space who relies largely on network fees, I consider V to be more vulnerable to regulations that could cap or restrict these fees. Finally, as aforementioned, V has a vast network globally. I anticipate its segment comprised of Central Europe, the Middle East, and Africa to suffer headwinds and remain depressed for the near future due to the conflicts in Israel.
All told, I expect the positives to be a dominating force in the years to come and rate Visa Inc. stock as a Buy. The gist of my buy thesis is simply the GARP opportunity. While the current P/E ratio may appear high, the EPS growth can quickly shrink it to very reasonable levels in a few years, and a discounted FCF model shows a large margin of safety. Finally, its consistent and sizable share buybacks further enhance the upside potential (and also serve as an indicator of its reasonable valuation and capital allocation flexibility).

